14 August 2023
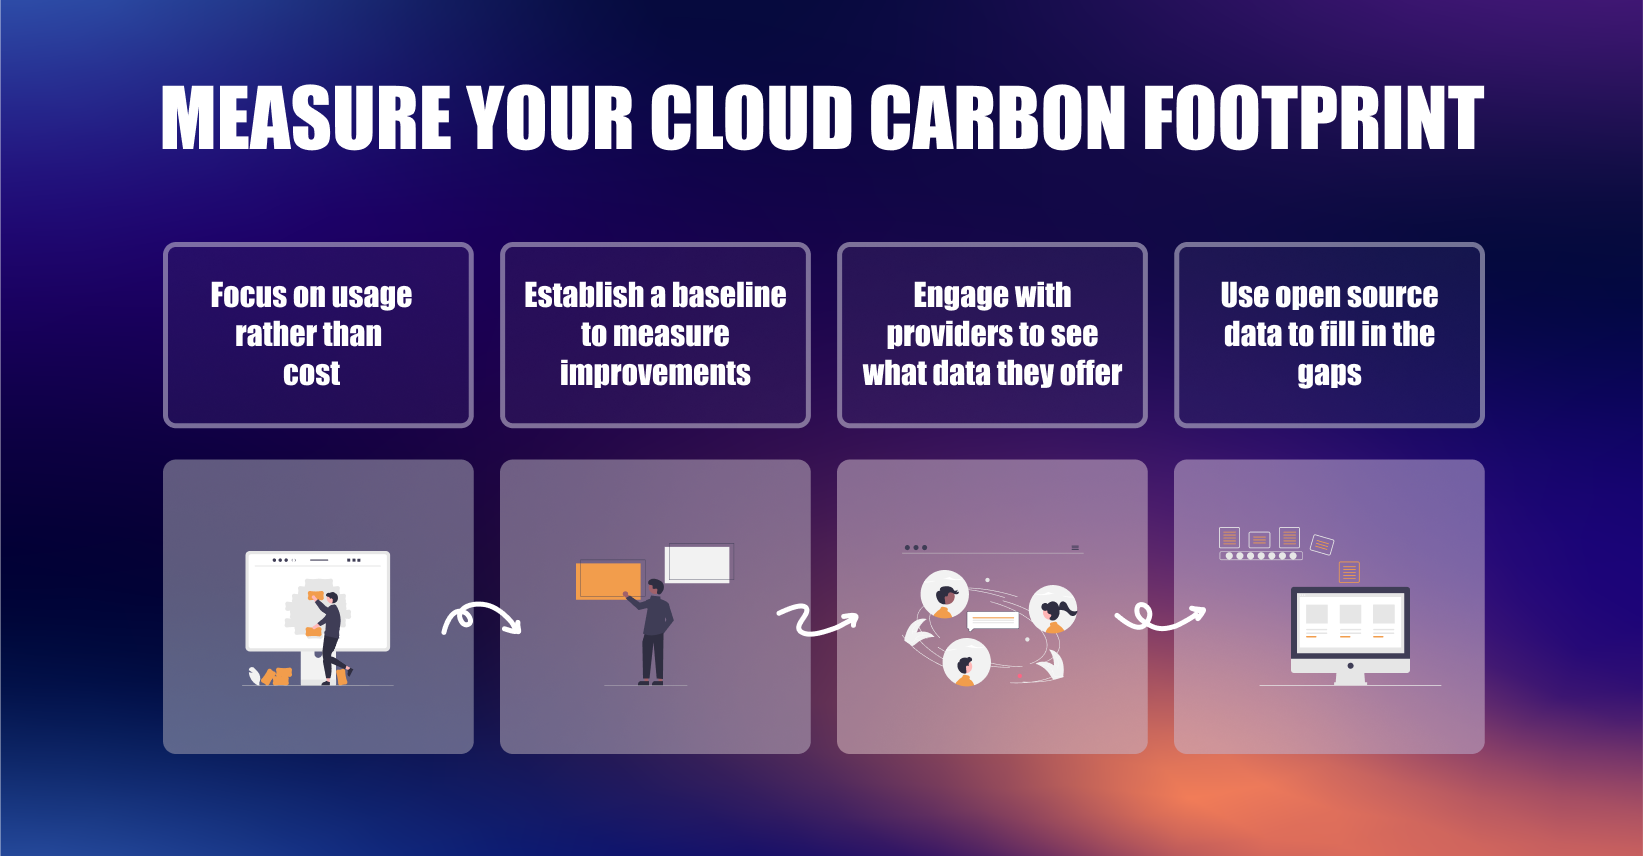
Measure your Cloud Carbon Footprint
By Tony Pimm, Partner, Modern Workplace and Paul Bevis, CTO.
With sustainability becoming a top priority for organisations worldwide and CIOs seeking specific energy consumption metrics to meet new regulations such as the European Union’s Corporate Sustainability Reporting Directive (CRSD), embarking on a sustainable Cloud journey is no longer a choice but a necessity.
The Cloud is an important enabler for sustainability, however whilst it can be more sustainable than traditional on-premises infrastructure, organisations still need to be able to baseline and reduce emissions caused by using the Cloud.
Measuring emissions generated by software has traditionally been measured in one of two ways:
- Measuring direct energy usage and inferring emissions from energy consumed.
- Measuring spend and then inferring emissions from total cost.
Both approaches are problematic in the Cloud; firstly, energy usage is rarely published and secondly because cost is a poor proxy for emissions. For example, many Software as a Service (SaaS) businesses use a per user license model and the cost is driven by the number of users rather than by usage. In addition, most cloud providers operating Infrastructure as a Service (IaaS) or Platform as a Service (PaaS) services offer discounts the more an organisation spends – whilst the costs may be discounted, the emissions driven by the usage is not. In short, reducing costs does not necessarily reduce emissions.
Cloud Insights
The big cloud providers such as Microsoft and Amazon are starting to take steps to try and make it easier for organisations to measure their cloud-based emissions and understand the emissions avoided through cloud usage over on-premises environments. For example, Microsoft now provide Power BI dashboards for both your Microsoft 365 and Azure workloads and Amazon provides a Customer Carbon Footprint tool for AWS workloads.
Both sets of tools are aligned with the Greenhouse Gas Protocol categories, the reports being grouped by three “scopes”:
- Scope 1: Direct emissions from a source that an organisation owns or controls directly, for example the emissions from company vehicles.
- Scope 2: Indirect emissions that an organisation causes when the electricity it uses is produced for example, electricity used to power an office or a data centre.
- Scope 3: Other indirect emissions from up and down an organisations’ supply chain for example, the use of a cloud service.
Microsoft 365
The Emissions Impact Dashboard for Microsoft 365 is based on an estimate of the datacentre emissions that Microsoft generates on your behalf to provide M365 services to your users, based on your data storage and active product usage. More information on how emissions are measured is available in Microsoft’s white paper.
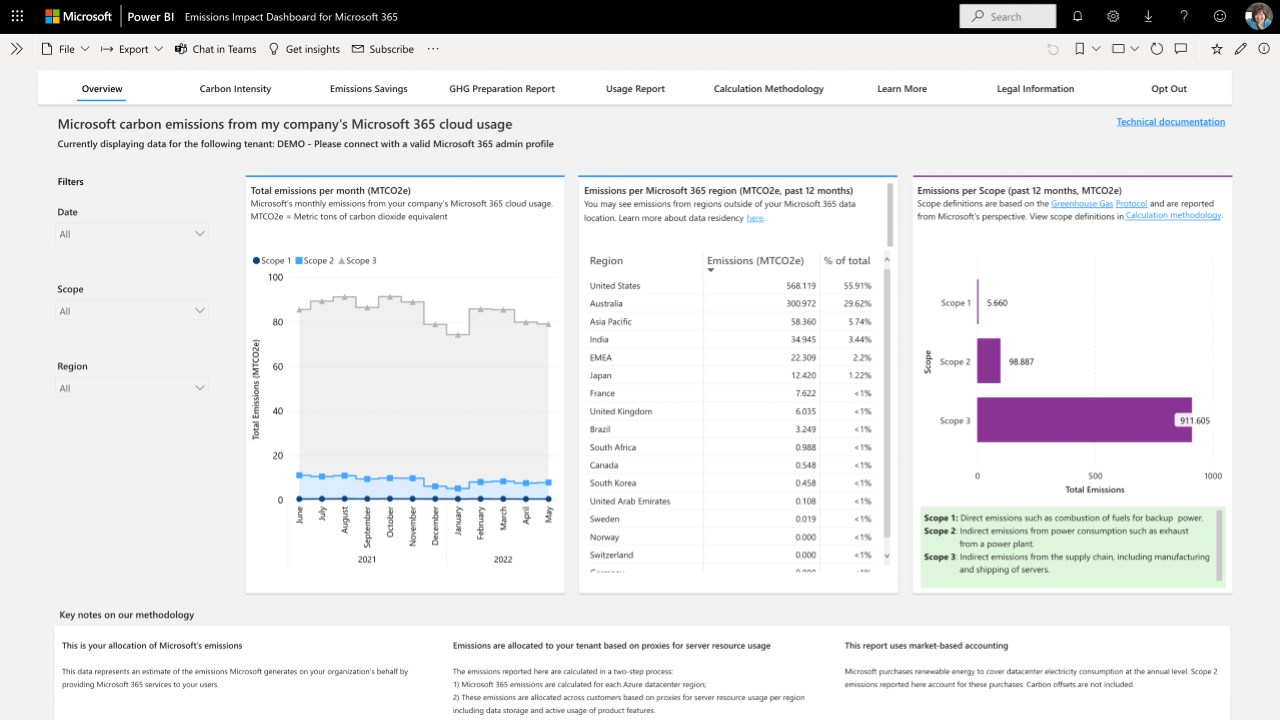
Figure 1 – Emissions Impact Dashboard for Microsoft 365
Some highlights of the Emissions Impact Dashboard for Microsoft 365 are:
- Total emissions per month (mtCO2e) by Scope and Region
- Carbon intensity per active user (gCO2e per user)
- Emissions avoided by using Microsoft 365 vs the equivalent of running the services on-premises
Azure
The Emissions Impact Dashboard for Azure provides more detailed information based on the specific cloud services which are being consumed from Microsoft, by subscription, region and specific service.
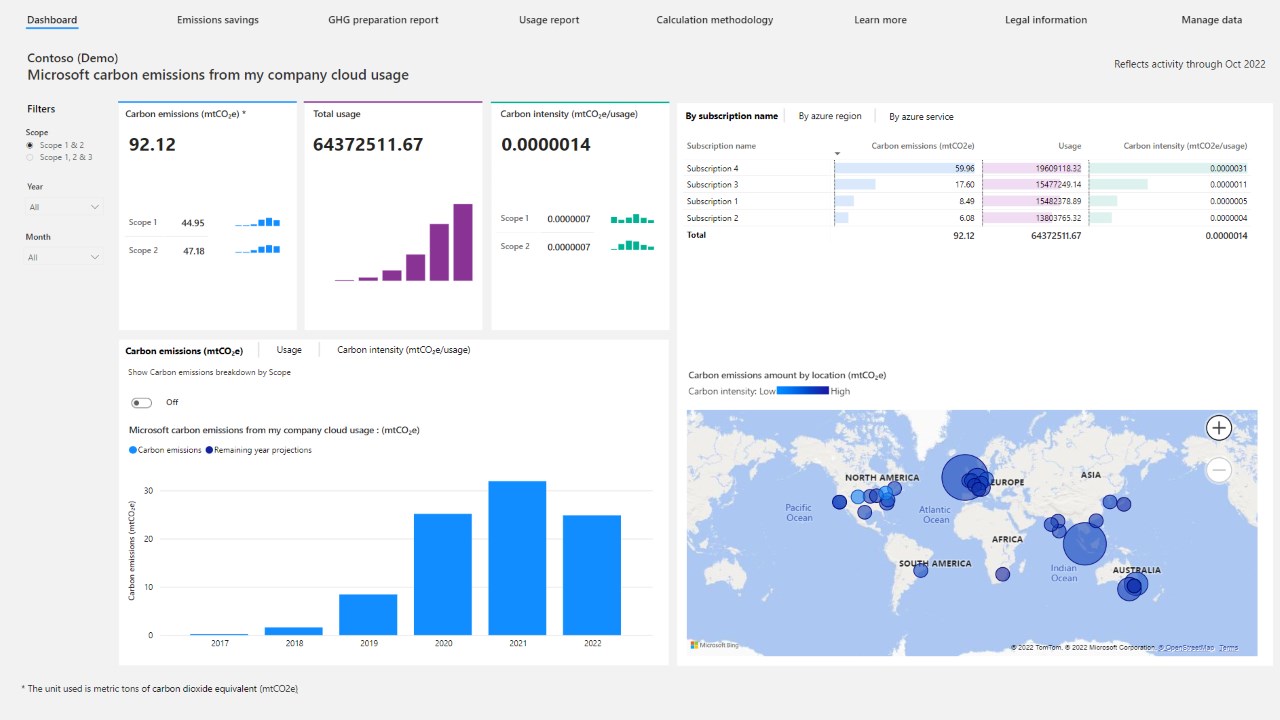
Figure 2 – Emissions Impact Dashboard for Azure
Some valuable areas of the Emissions Impact Dashboard for Azure are:
- Carbon emissions (mtCO2e) by year and by Carbon intensity (mtCO2e/usage) per user
- Carbon emissions, usage, and Carbon intensity per Azure Service and Region
- Emissions Savings (mtCO2e) by hosting the services in Microsoft Cloud vs an on-premises equivalent.
Note Microsoft also provide a calculator to compare an existing on-premises server footprint with a comparable Azure footprint, valuable for any pre-emptive planning for a cloud migration.
AWS
Amazon’s Carbon Footprint Tool for AWS provides emissions data broken down by geography and service.
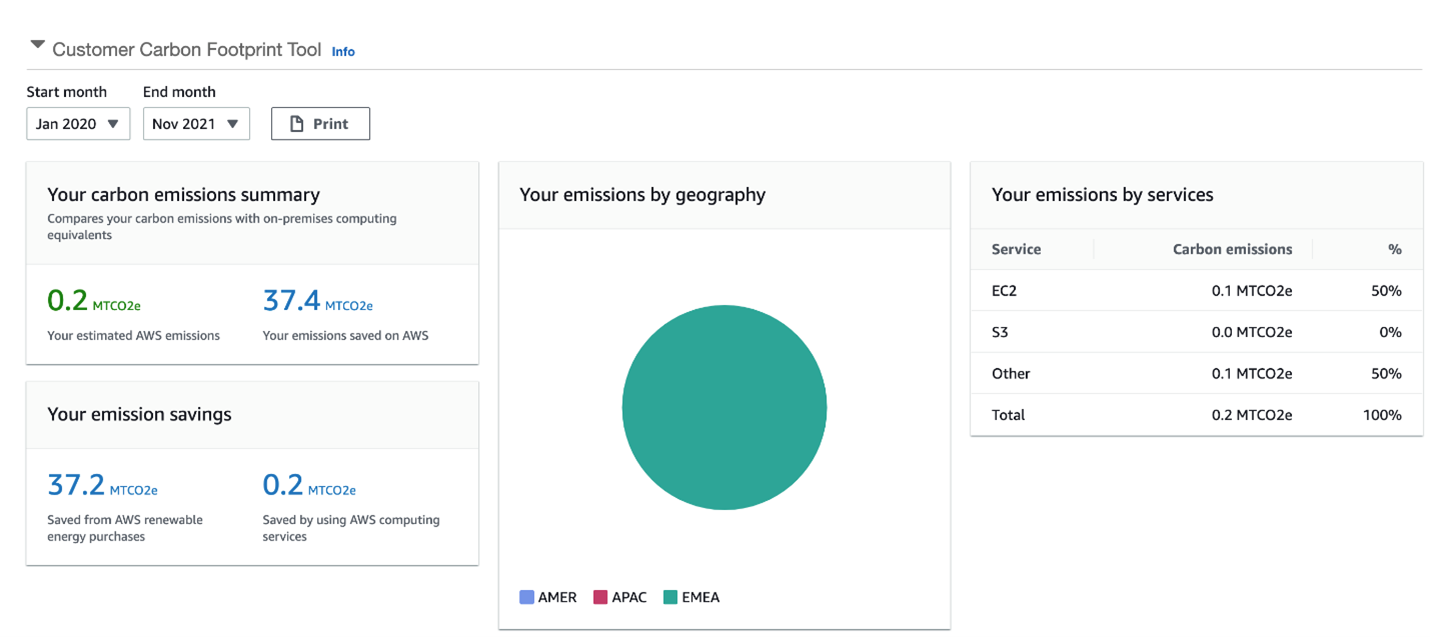
Figure 3 – Cloud Carbon Footprint Tool for AWS
Some valuable areas of the Carbon Footprint Tool for AWS are:
- Emissions Savings (mtCO2e) by hosting the services in AWS vs an on-premises equivalent.
- Path to 100% renewable energy which shows how your carbon emissions will change over time as AWS moves toward its goal of powering its operations with 100% renewable energy. These figures are based on your current AWS usage profile.
Considerations
Whilst these tools offer valuable insight, there are some gotchas that you need to consider:
- Both organisations say that the data they provide is for informational purposes and should not be used for “legal compliance, marketing or reporting purposes”
- Scope 2 emissions, i.e. the emissions emitted to generate the electricity that Microsoft or Amazon use to provide you with a service, are offset through Power Purchase Agreements (PPAs). We cover the PPAs in our white paper on sustainable digital transformation and why they are a consideration when managing your suppliers.
Going it alone
But what do you do if your cloud provider doesn’t provide emissions data? Initially you should try engaging with your provider – as you would with any other supplier – to understand their roadmap for providing emissions. In the absence of emissions data, ask your provider for energy usage or what resources you use (compute, memory, storage and bandwidth).
If you are able to get energy usage data, you can use services like Electricity Maps (https://www.electricitymaps.com/) to then calculate the emissions emitted in relevant region of the world.
If you can get resource usage data you can use services like Climatiq (https://www.climatiq.io), which provides access to a consolidated database of vetted emission factors from various data providers. Emission factors include those for cloud computing, air travel, transportation and energy. By extracting your cloud usage data, such as CPU, memory, storage and bandwidth, you can use granular emission data from Climatiq to calculate your emissions data.
Whilst the above methodologies may not be perfect, they should not be a blocker to starting to baseline your cloud emissions, from which you can measure improvements. As cloud providers introduce or improve their offering you will then be a good position to capitalise on their investments to improve your own process.
Summary
Through using the standard tools provided by your cloud provider, or extracting and analysing your usage data yourself (rather than cost), you can measure and baseline your emissions cloud emissions. This data will then allow you to identify the services that are emitting the most carbon and track the impact of your GreenOps initiatives to reduce your cloud carbon footprint.
Emissions Impact Dashboard for Microsoft 365:
Emissions Impact Dashboard for Azure:
AWS Customer Carbon Footprint Tool:
Partnering with FSP for a Sustainable Future
If you want to explore other enablers for achieving sustainable digital transformation, we invite you to check out our white paper which also contains pragmatic advice for digital leaders looking to find out more about sustainability and how it can benefit their transformation initiatives. Feel free to get in touch with us at sustainability@fsp.co to find out more about these topics and discuss how we can help your organisation thrive in the realm of sustainability.